A while back a VP pulled me aside after a delivery review. He wanted a dashboard. Commits per engineer, story points closed, pull requests merged, ranked top to bottom. "I need to see who isn't pulling their weight," he said.
I asked him one question. "Name someone on the team you think isn't pulling their weight."
He named three people in four seconds flat.
He didn't need a dashboard. He already had his answer. What he wanted was a number to make his hunch look objective. He wanted evidence for a verdict he'd already reached.
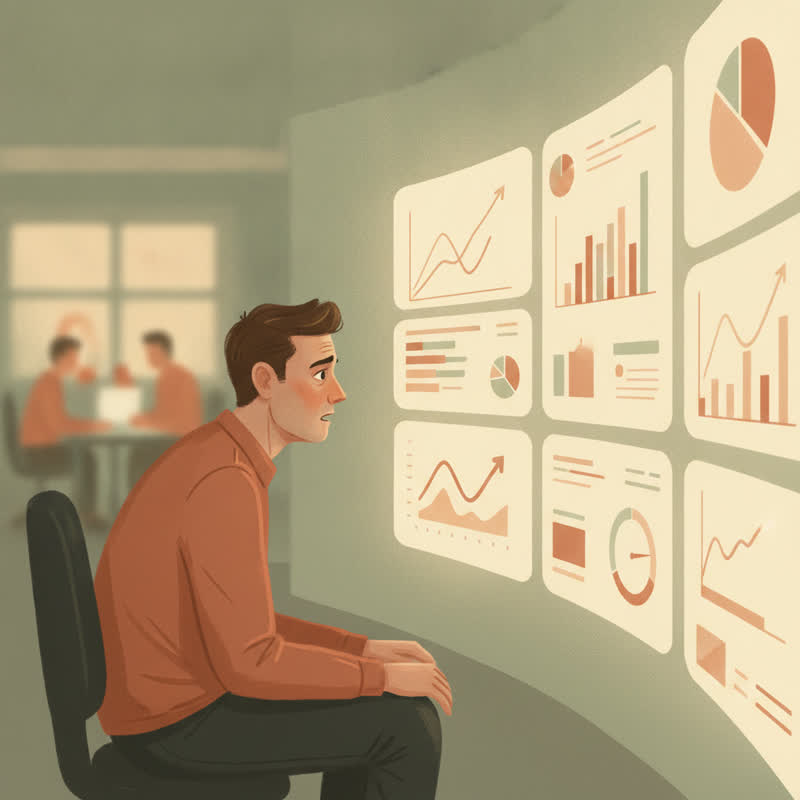
There it is. When a leader asks me for individual productivity metrics, the problem is almost never the engineers. The problem is a manager who has lost the ability to tell good work from bad work by looking at it, and wants a machine to do the looking instead.
You don't have a high performer problem. You have a trust deficit.
Look at how far this has gone
This isn't a few paranoid managers with spreadsheets. It's now the default.
ExpressVPN surveyed 1,500 US employers and 1,500 employees with Pollfish. Seventy-four percent of companies use online monitoring tools. Fifty-nine percent do real-time screen tracking. Sixty-two percent pull web browsing logs. Sixty-one percent run AI-driven productivity metrics on their own staff.
Then look at what it costs. In the same survey, 49% of workers said they'd consider leaving if surveillance increased. Twenty-four percent said they'd take lower pay to escape invasive monitoring.
Read it again. A quarter of your people would pay money to get out from under your dashboard. You built a tool to increase output and your team values its removal at a percentage of salary.
Nobody puts this in the business case.
The metrics lie, and everyone knows it
Here's the thing engineering leaders keep refusing to accept. There is no number for this.
Microsoft Research, GitHub, and the University of Victoria published the SPACE framework and led with the point everyone skips: developer productivity cannot be measured by a single metric or dimension. Not lines of code. Not commits. Not pull requests. Not story points.
The reason is simple. Every one of those numbers measures volume, and volume is trivially gamed by the exact people you're worried about.

Put a commit counter on a team and watch what happens within two sprints:
- Big changes get split into eight small commits.
- Nobody touches the gnarly legacy module, because a week spent understanding it produces no artifacts.
- Refactoring stops, since deleting 400 lines shows as negative output.
- Pairing dies. Two names on the work halves each person's score.
- Story points inflate. Every ticket becomes a five.
Meanwhile the engineer who spent three days reading logs, found the race condition, and fixed it with a four-line patch sits at the bottom of your ranking. She saved the company a weekend outage. Your dashboard shows her as your worst performer.
The senior people spot the game in a week. Your strongest engineers... the ones with options... update their resumes. The ones who stay are the ones who are good at the game. Congratulations, you've selected for it.
The real diagnosis
A dashboard request is a symptom. Underneath it sits one of three things, and none of them are about your team.
You've lost technical proximity. You've been out of the code for four years and you no longer know what "hard" looks like in this system. So a four-line fix reads as a slow week. This one is honest and fixable. Get closer to the work, ask people to walk you through it, and accept you're rebuilding your judgement.
You're managing upward under pressure. Your boss asked what the team's been doing and you didn't have a crisp answer, so you reached for numbers to protect yourself. The dashboard isn't for managing the team. It's armour.
You're insecure in the role. This is the ugly one. Control feels like competence. If you're across every ticket, every branch, every hour, then surely you're doing your job. You're not. You're doing theirs, badly, while yours goes undone.
I'll be blunt about which one is most common. It's the third.
What the deficit costs you
Robert Half ran a survey on this a decade ago and the findings have aged depressingly well. Fifty-nine percent of workers said they'd worked for a micromanager. Of those, 68% said it decreased their morale and 55% said it hurt their productivity.
Sit with the second figure. The intervention designed to raise output lowered it, by the account of the people doing the work.

My own research points the same direction. When I surveyed people about their working lives, 99.5% said they'd had one or more types of bad boss. Not a minority experience. Near universal. I write about the patterns behind it over at Step It Up HR.
And the 2024 DORA report found something worth pinning above your desk: unstable organizational priorities cause meaningful decreases in productivity and substantial increases in burnout. Note where the instability sits. Not in the engineers. In the priorities set above them.
The same report found developers with a user-centric mindset are more productive, more satisfied, and less likely to burn out. Focus on the user, and the numbers follow. Focus on the numbers, and you get numbers.
What to do instead
Fine, you say. I still need to know whether the work is going well. Correct. You do. Here's how to get there without a surveillance stack.
Read the output, not the activity. Open the pull requests. Read the code. Read the review comments. Look at the design docs. Twenty minutes a week with the actual artifacts tells you more about an engineer's judgement than a year of commit counts. If you're too senior to read the work, you're too senior to have an opinion on who's underperforming.
Ask the team. Engineers know exactly who is carrying and who is coasting. They've known for months. They won't tell you through a form, and they won't tell you in a group setting. They'll tell you in a one to one, once they trust you'll handle it like an adult. Building the trust is the job.
Measure the system, not the humans. Deployment frequency, lead time, change failure rate, time to restore. Team-level, never individual. These numbers describe how well your delivery machine works, and improving them is your responsibility, not your engineers'. Nobody games a metric they aren't ranked on.
Handle the actual underperformer directly. If you have one, and sometimes you do, you already know who it is. You knew before the dashboard. Deal with it: clear expectations, honest conversation, a real timeline, support to improve, and a decision at the end. Surveilling twelve people to build a case against one is cowardice with a subscription fee.

The question underneath
Every tracking tool you install is a sentence spoken out loud to your team: I do not believe you are working unless I watch you.
Your team hears it. They hear it on day one. And they respond the way people always respond to being watched, by optimizing for what's visible rather than what matters. You get the behaviour you monitor, never the behaviour you wanted.
Trust isn't a soft thing you sprinkle on after the delivery plan. It's the mechanism. It's what lets an engineer spend three days on a hard problem without producing a status update, and lets you sleep while she does it. Take it away and the work doesn't get more visible... it gets smaller, safer, and more theatrical.
So before you commission the dashboard, ask yourself the harder question. Not "who isn't pulling their weight?"
Ask: what happened to my ability to tell?